Creating a DE&I (diversity, equity, and inclusion) data toolkit can seem daunting at first glance, especially if you are not a seasoned HR or DE&I professional.
But it doesn’t need to be. Your data toolkit simply involves gathering and analysing relevant data to understand the current state of diversity and inclusion within your organisation or community.
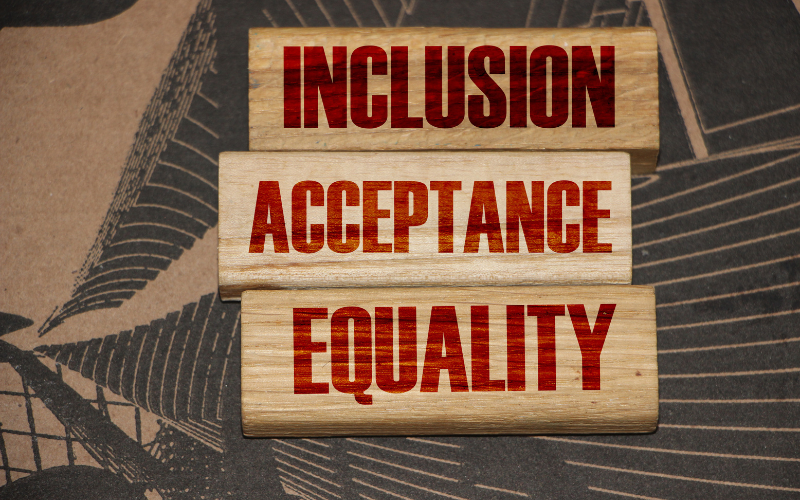
Your data toolkit is invaluable when you need to provide insights, identify gaps, and guide decision-making to promote diversity and equity. But it also has many business implications, especially when linking your DE&I strategy with your business’s long-term goals.
Here are the steps to create a DE&I data toolkit:
Define the Purpose:
Determine the objectives of your DE&I data toolkit. Identify the specific areas you want to measure and the insights you hope to gain. For example, you might focus on representation, pay equity, employee satisfaction, or promotion rates. All are important options, but ensure you know why they matter to your business.
Identify Key Metrics:
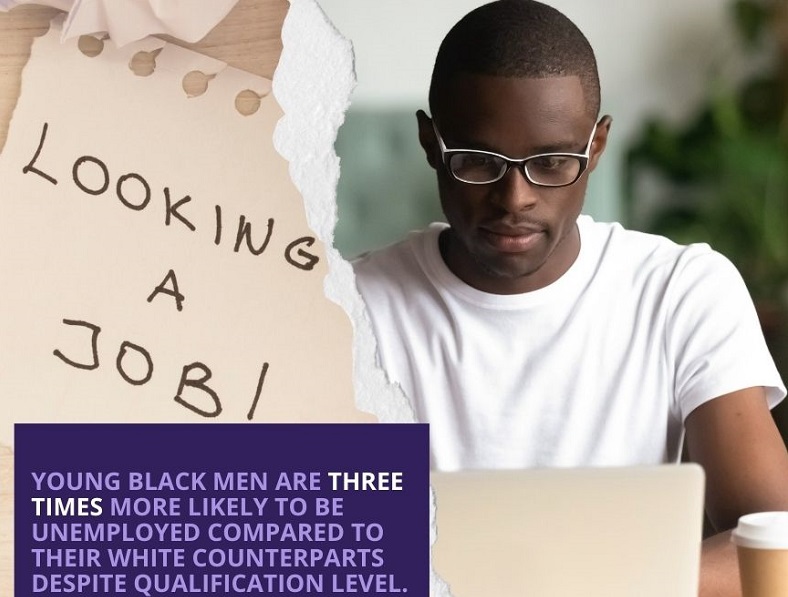
Determine the metrics that align with your objectives. Choose metrics that provide a comprehensive view of your organisation’s diversity landscape. Some common DE&I metrics include demographic data (gender, race, ethnicity, age, etc.), employee engagement surveys, retention rates, promotions by demographic groups, and compensation data.
Data Collection:
It sounds like common sense, but ensure to collect the relevant data for each identified metric. This can be done in several ways and may involve surveys, questionnaires, interviews, and analysing existing HR and organisational data. Ensure that the data collected is accurate, consistent, and protected in accordance with privacy regulations.
Data Analysis:
Next you need to analyse the collected data to gain meaningful insights. For the best results, use statistical techniques to identify patterns, trends, and disparities across different demographic groups. Compare the data against industry benchmarks or external data sources (ONS statistics, research, annual reports, or even job boards) to gain context and identify areas for improvement.
Visualisation and Reporting:
Now you have to present the analysed data in a clear and visually appealing manner to effectively communicate your findings. Use charts, graphs, and dashboards to illustrate key metrics, trends, and comparisons. Prepare reports that highlight areas of strength and areas needing improvement, along with actionable recommendations.
Identify Actionable Steps:
Based on the insights gained from the data analysis, develop a set of actionable steps to address any disparities or gaps identified. These steps should be specific, measurable, achievable, relevant, and time-bound (SMART goals). Consider involving key stakeholders and DE&I experts to ensure comprehensive and effective strategies.
Implement and Monitor Progress:
Put the actionable steps into practice and monitor their progress over time. Continuously collect and analyse data to assess the effectiveness of the implemented strategies. Be sure to make adjustments as needed and ensure you have an ongoing commitment to diversity and inclusion efforts from all stakeholders.
Iterative Improvement:
Treat the creation of the DE&I data toolkit as an iterative process. It’s never a case of ‘job done’. Learn from the feedback, evaluate the effectiveness of your toolkit, and refine your metrics and strategies accordingly. Continuously update and improve your toolkit to adapt to evolving DE&I goals and challenges and, ultimately, success.
Remember, creating a DE&I data toolkit is a continuous process. Regularly revisit and update it for the toolkit to remain relevant and aligned with your organisation’s evolving DE&I goals and priorities. Created and used wisely, it will be hugely rewarding.